EUR/JPY Price Analysis: Dives to three-month lows, on broad JPY strenght
- The shared currency is soft, vs. the Japanese yen, which is staging a comeback against most G10 peers.
- The EUR/JPY daily chart illustrates the pair as neutral-to-downwards, but the downtrend losses steam.
- In the short term, the EUR/JPY might print a leg-up before dipping towards 134.00.
The EUR/JPY creeps lower for the third consecutive day, shifting its bias from neutral to neutral-to-downwards due to heightened tensions between the US and China ahead of the visit of US House Speaker Pelosi to Taiwan. Also, traders scaled back their bets in the US stock market as Fed officials pushed back against a possible “dovish” tilt, while a tranche of policymakers would cross wires on Tuesday. At the time of writing, the EUR/JPY is trading at 135.15.
EUR/JPY Price Analysis: Technical outlook
The EUR/JPY daily chart illustrates the pair as neutral-to-downward biased. Once the EUR/JPY broke below the July 8 daily low at 136.85, it accelerated its dive towards the 135.00 mark. Nevertheless, the EUR/JPY downtrend is on its way to the 200-day EMA at 133.69, but near term, a correction towards the 136.00 figure is on the cards.
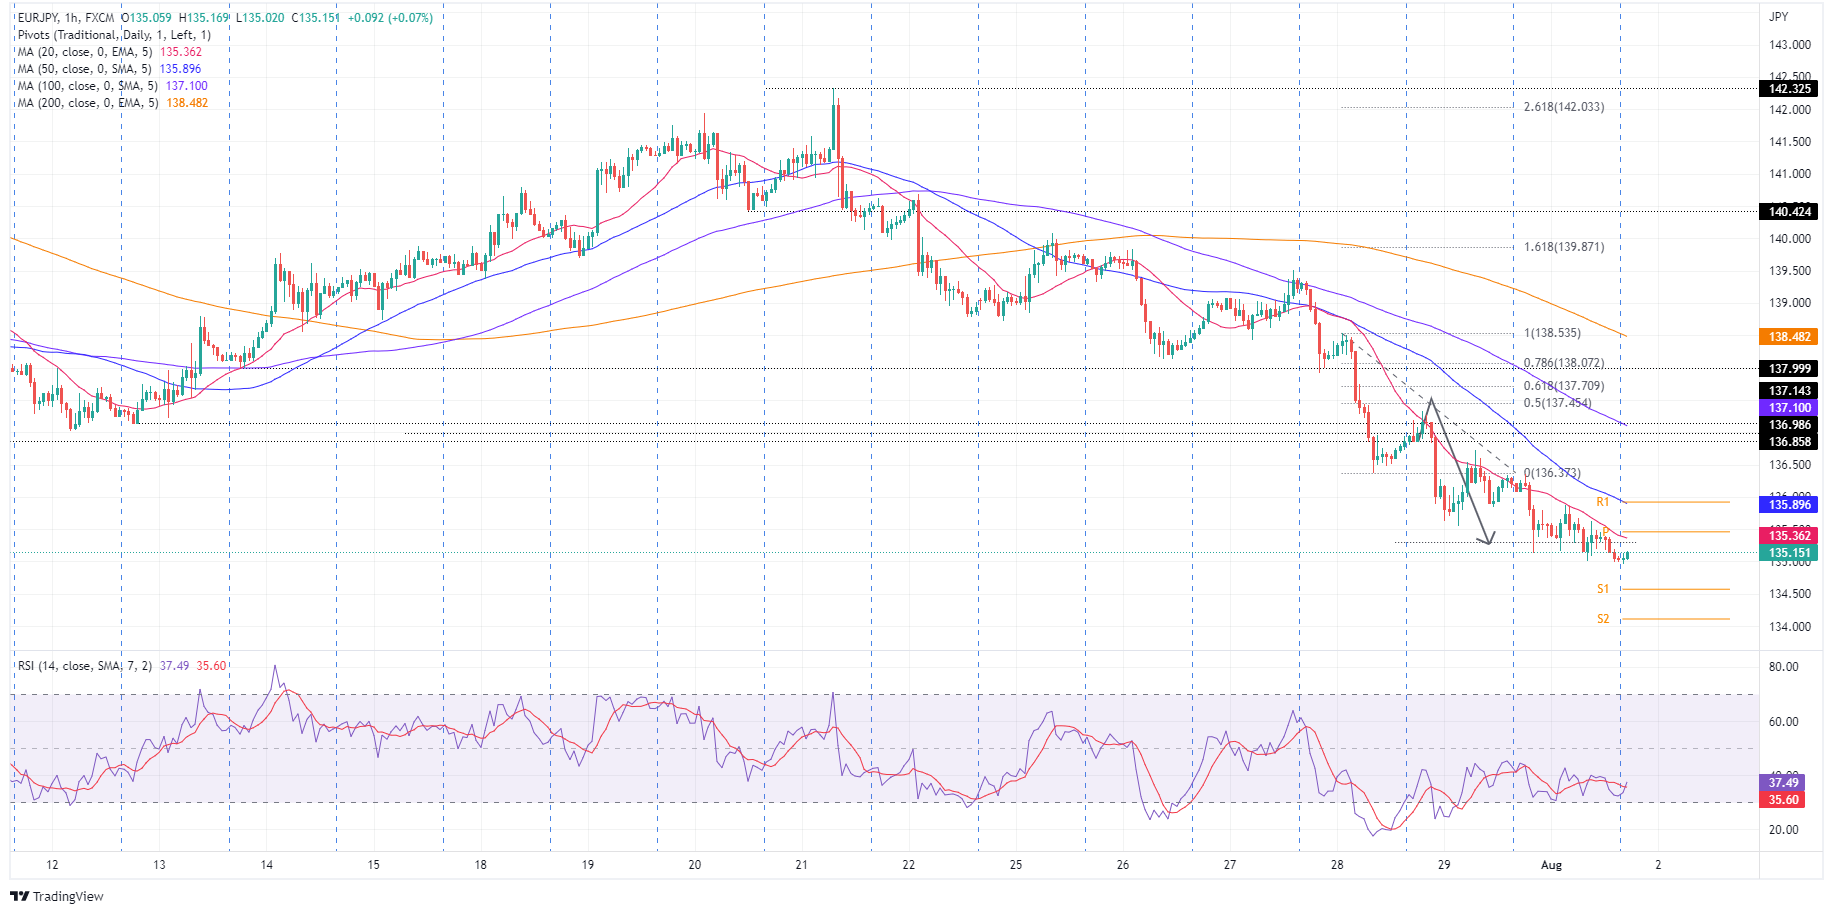
EUR/JPY 1-hour chart
In the short term, the EUR/JPY shows that the cross is consolidating around the low 135.00, confirmed by the Relative Strength Index (RSI), trapped within the 30-45 readings. Therefore, EUR/JPY sellers are taking a breather before pushing the pair towards fresh three-month lows, below 134.96. If EUR/JPY bulls step in, the EUR/JPY will challenge the confluence of the 50-hour EMA and the R1 daily pivot at 135.89.
If that play works, the EUR/JPY first support would be 135.00. Break below will expose the S1 daily pivot at 134.57. Once cleared, the next support would be the S2 pivot point at 134.11.
EUR/JPY Key Technical Levels