GBP/USD Price Analysis: Pokes short-term resistance line above 1.3500
- GBP/USD grinds higher around weekly top following three-day uptrend.
- A three-week-old resistance line tests buyers ahead of 100-SMA.
- Bullish MACD, sustained break of 50-SMA favor buyers.
- Sellers need validation from 61.8% Fibonacci retracement to take fresh entries.
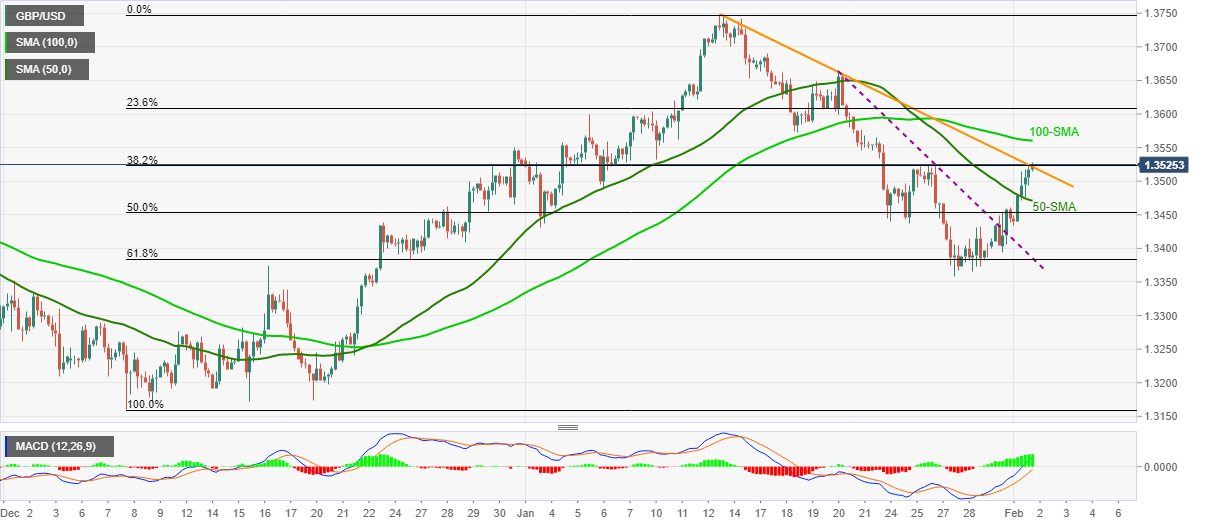
GBP/USD bulls attack nearby resistance line around the weekly high of 1.3528 during Wednesday’s Asian session.
In doing so, the pair buyers take a breather following a three-day rebound from the 61.8% Fibonacci retracement (Fibo.) of December 2021 to early January 2022 upside.
Other than the bounce from the key Fibo. level, firmer MACD and the cable pair’s ability to stay beyond the 50-SMA level also keeps buyers hopeful to overcome the immediate trend line resistance, stretched from January 13, around 1.3530.
Even so, the 100-SMA level near 1.3560 will act as an extra filter to the north before fueling the GBP/USD prices towards the previous month’s peak of 1.3748.
Alternatively, pullback moves may aim for the 50-SMA level of 1.3470 ahead of highlighting a convergence of the previous resistance line from January 20 and 61.8% Fibonacci retracement level surrounding 1.3385.
It’s worth noting that January’s low of 1.3357 could also test the GBP/USD bears before giving them controls to aim for the sub-1.3300 area.
GBP/USD: Four-hour chart
Trend: Further upside expected