USD/CAD Price Analysis: Bulls remain hopeful despite recent pullback
- USD/CAD buyers catch a breather after closing beyond 50-day EMA for the first time since October 30, 2020.
- Bullish MACD, sustained break of the key EMA portray strength of bullish momentum.
- Sellers should look for entries below the two-week-old support line.
Following its first daily closing beyond 50-day EMA in multiple days, USD/CAD eases to 1.2850 during the initial Asian session on Tuesday. Even so, bullish MACD, an ascending trend line from January 21 and sustained break of the key EMA favor the buyers.
However, fresh buying is likely to take place beyond January’s high of 1.2881 while targeting the 1.2930-25 horizontal area that comprises multiple levels marked since the early November of 2020.
Also acting as an upside barrier is the 100-day EMA level of 1.2953 that holds the key to the USD/CAD run-up towards the 1.3000 psychological magnet.
Alternatively, a downside break of 50-day EMA, at 1.2820 now, needs confirmation from an ascending trend line a short-term support line near 1.2780 to recall the USD/CAD sellers.
Following that, January’s bottom surrounding 1.2590 will regain the market’s attention the mid-December lows around 1.2690 may offer an intermediate halt during the fall.
Overall, USD/CAD is up for a bull-run but a three-month-old horizontal area becomes a tough nut to crack for the buyers.
USD/CAD daily chart
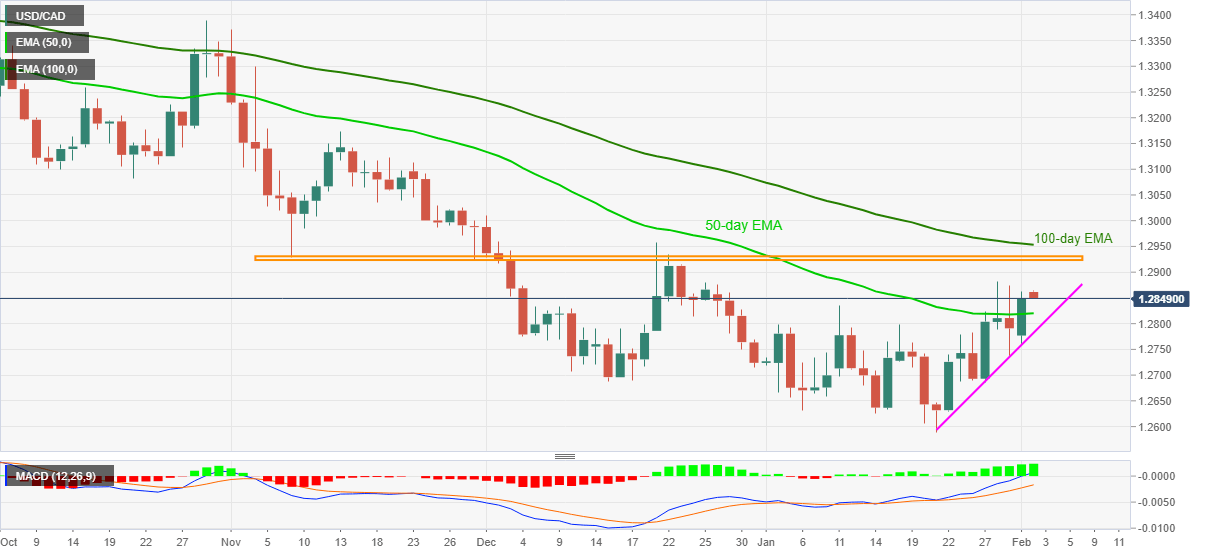
Trend: Bullish