WTI Price Analysis: Slips below $41.00 inside monthly ascending triangle
- WTI remains pressured after stepping back from the resistance line of a short-term triangle.
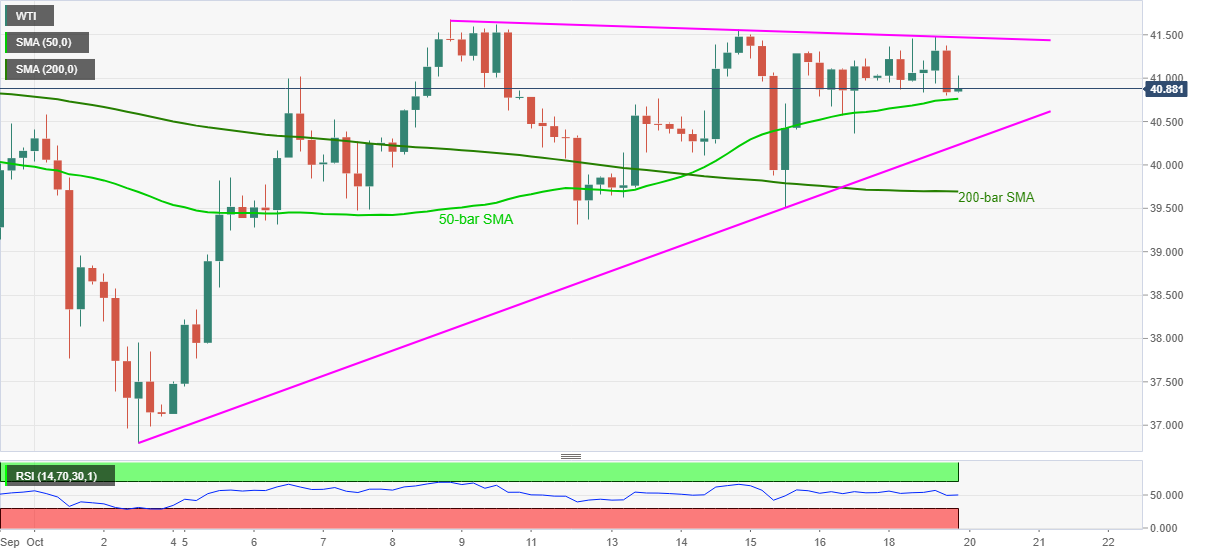
- 50-bar SMA offers immediate support, 200-bar SMA adds to the downside filter.
- A clear break of $42.10 becomes necessary to convince buyers.
WTI fails to keep the late-US session bounce off $40.79 while declining from $41.03 to $40.90 during the early Tuesday morning in Asia. In doing so, the energy benchmark keeps an ascending triangle formation established since October 02 while taking the rest on the 50-bar SMA in the meantime.
Considering the normal RSI conditions, the oil sellers are less likely to look for entries unless witness a break of $40.75 immediate support, comprising 50-bar SMA.
However, the support line of the mentioned triangle and 200-bar SMA, respectively around $40.20 and $39.70, will act as tough nuts to crack for the WTI bears.
On the flip side, the upper line of the triangle, at $41.47 now, won’t be enough to recall the bulls as September 04 high near $42.10 challenges the black gold’s further upside.
Should the quote rises beyond $42.10, the September month’s high of $43.55, followed by the August month’s peak surrounding $43.85, will be in the spotlight.
WTI four-hour chart
Trend: Further weakness expected