Back
12 Feb 2020
GBP/USD Price Analysis: Eyes on 21/50-day EMA during further recovery
- GBP/USD snaps two-day winning streak.
- A confluence of the key short-term EMAs, 61.8% Fibonacci retracement will challenge buyers.
- November 2019 bottom could return on the sellers’ radars during fresh declines below the weekly low.
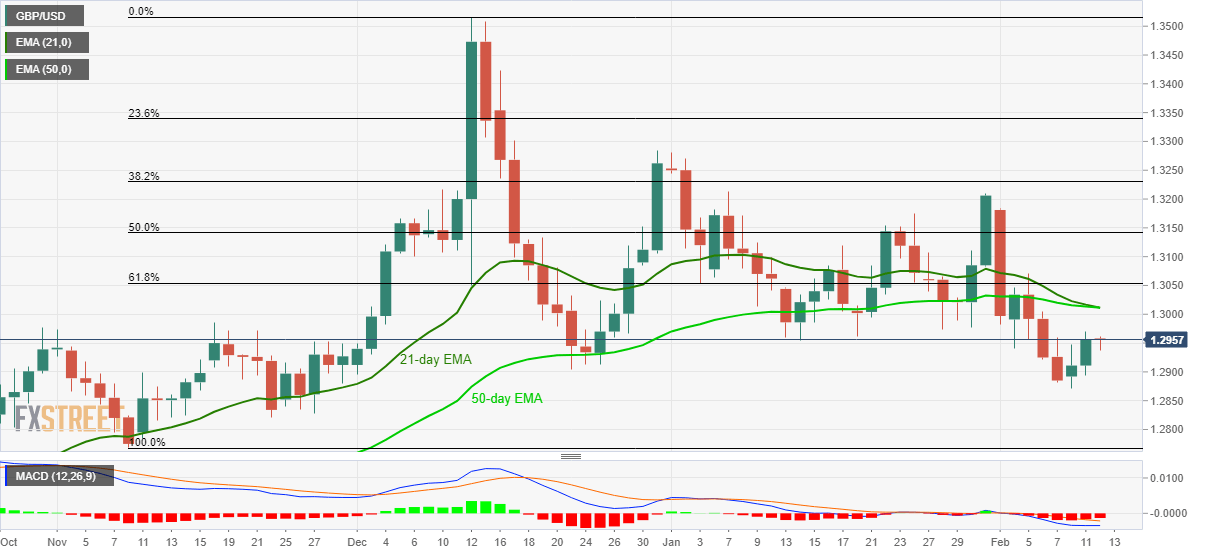
GBP/USD remains mildly weak around 1.2960 during the Asian session on Wednesday. Even so, the pair holds onto recovery gains from Monday while heading towards the confluence of 21-day and 50-day EMAs.
In addition to 1.3010/15 resistance confluence, 61.8% Fibonacci retracement of November-December upside, at 1.3055, also acts as the key resistance.
If at all the GBP/USD prices manage to cross 1.3055 on a daily closing basis, their run-up to January 31 top near 1.3210 can’t be ruled out.
On the downside, the weekly low around 1.2870 becomes important if the pair declines below 1.2900 immediate support.
During the pair’s additional weakness below 1.2870, November 2019 low around 1.2790 could lure the bears.
GBP/USD daily chart
Trend: Pullback expected