Back
11 Feb 2020
US Dollar Index Price Analysis: DXY exhausted before reaching the 99.00 figure
- DXY is down for the first day in the last six sessions.
- A correction down might be in the making.
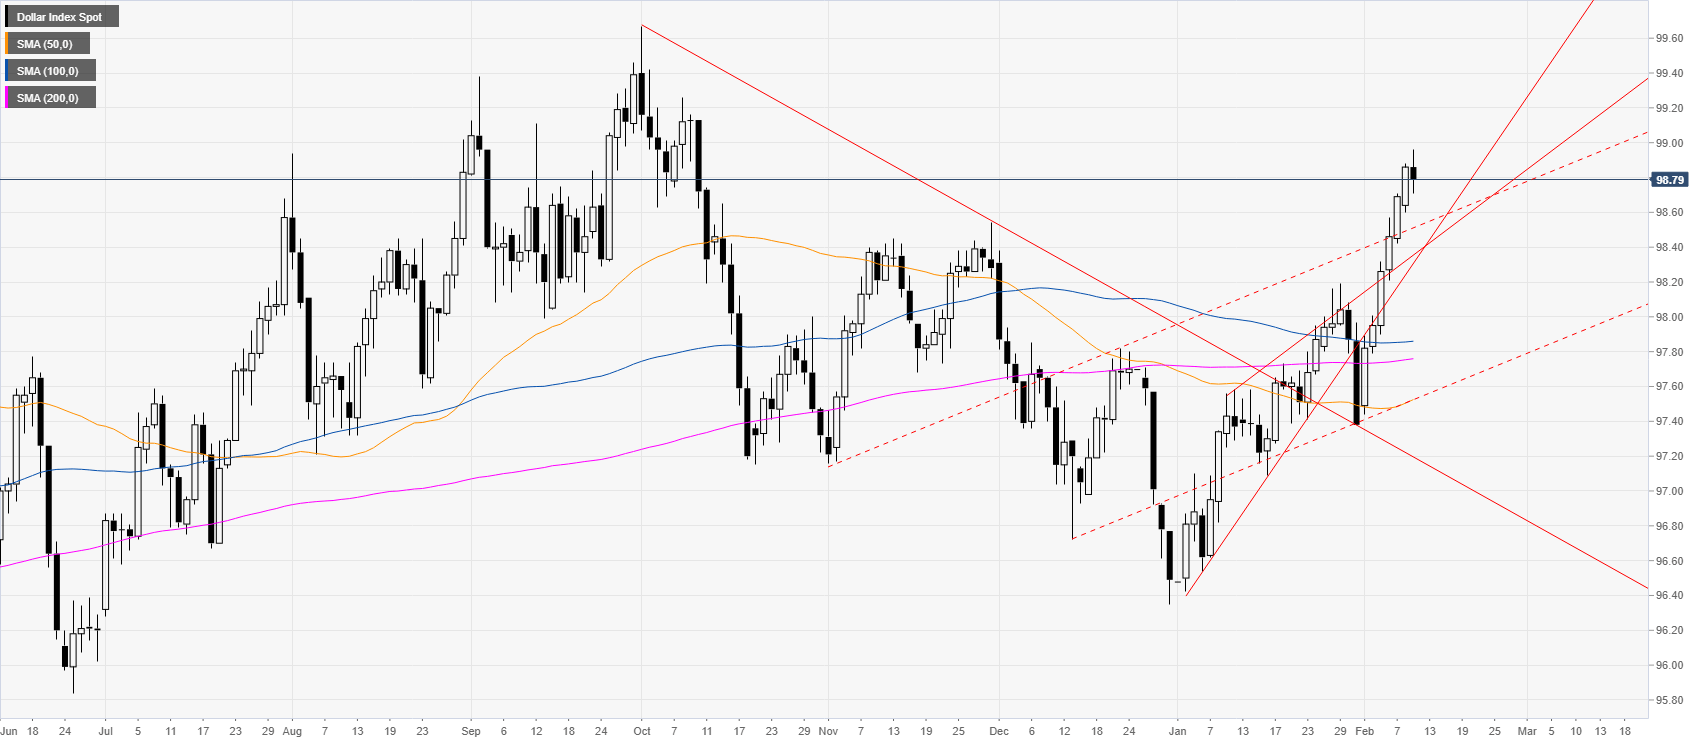
DXY daily chart
The US dollar index (DXY) is trading at its highest point since October while trading well above the main daily simple moving averages (SMAs). The market is correcting after trading up in the last six sessions.
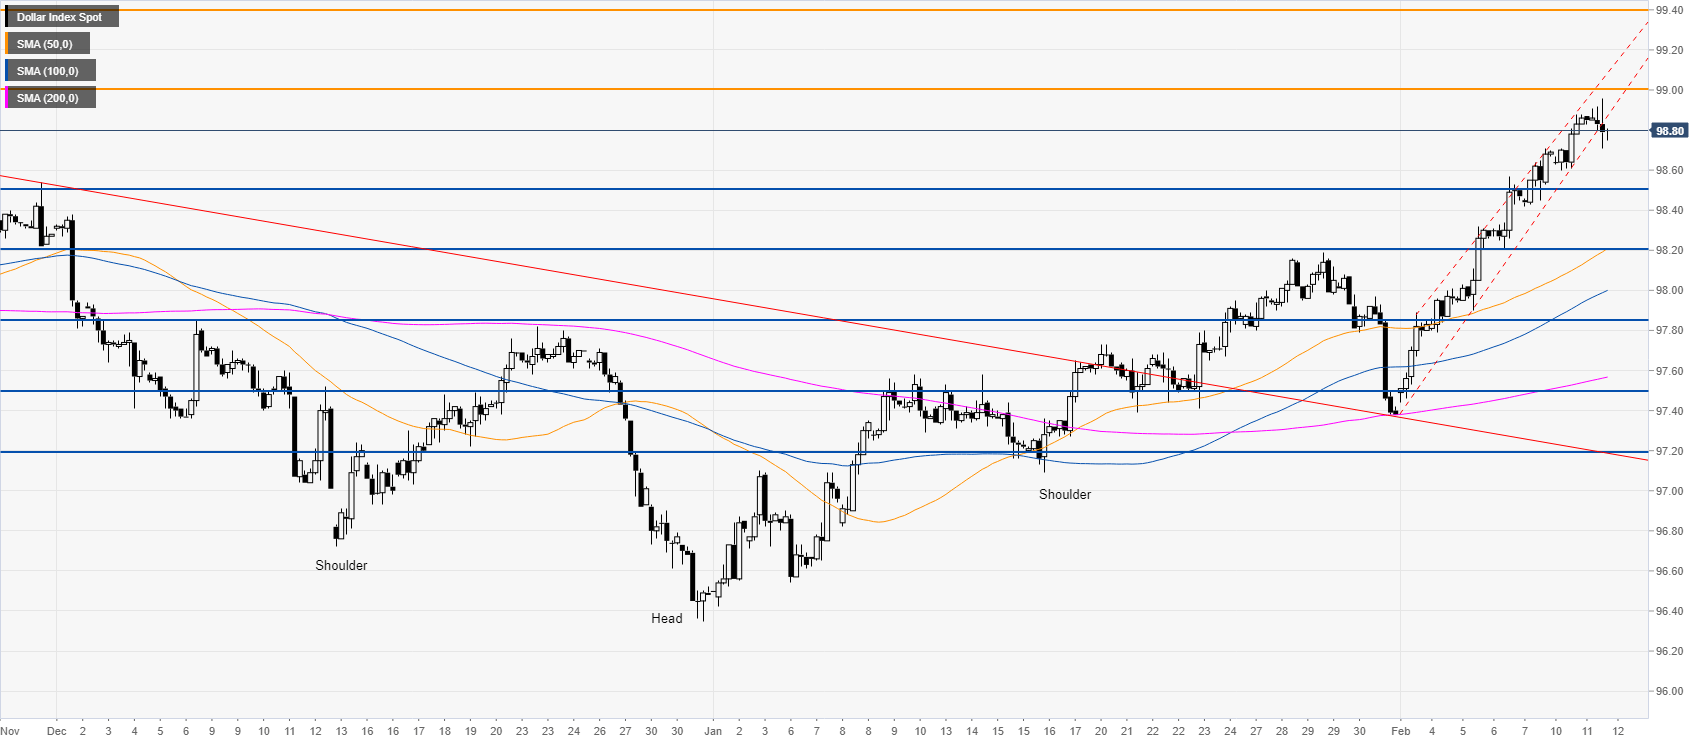
DXY four-hour chart
DXY is trading in a tight bull channel and is retracing down slightly below the 99.00 figure. Although the bias remains bullish, the market can be exhausted and at risk for a pullback down towards the 98.50 and 98.20 levels. On the flip side, if the buyers overcome the 99.00 mark, then the uptrend can extend towards the 99.40 level.
Additional key levels