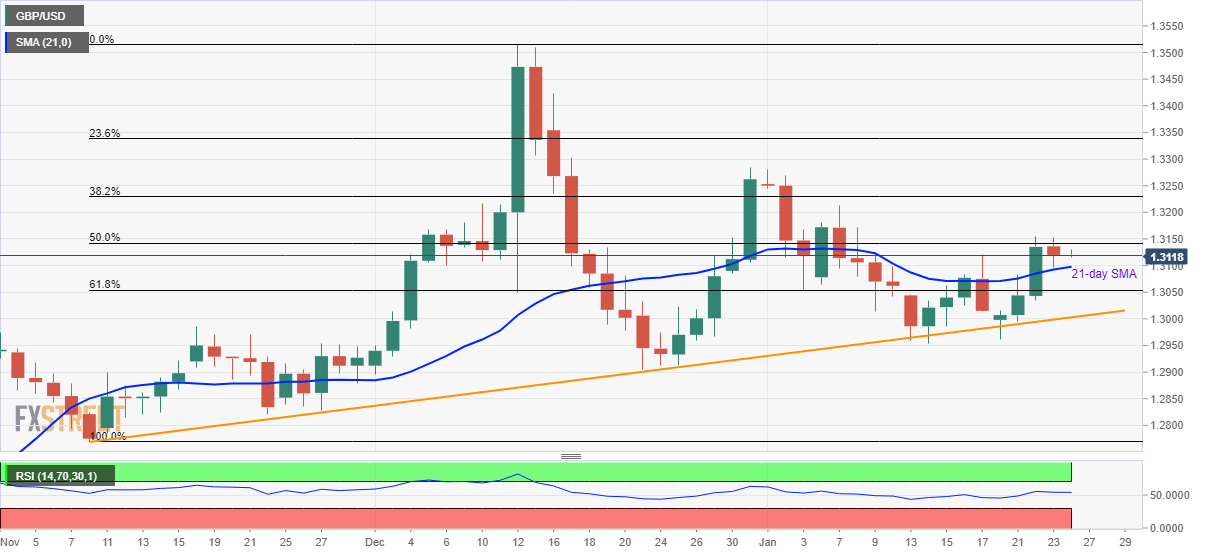
GBP/USD Price Analysis: Under pressure between 21-day SMA and 50% Fibonacci
- GBP/USD remains below 50% Fibonacci retracement for two weeks in a row.
- An ascending trend line since early-November acts as strong support.
- An upside break beyond Wednesday’s high could challenge the monthly top.
GBP/USD remains mildly negative while trading near 1.3120 during the Asian session on Friday. The pair took a U-turn from 50% Fibonacci retracement of its November-December 2019 upside on the previous day. Even so, prices carry the 21-day SMA breakout registered on Wednesday.
Hence, a daily closing beyond the 45-pip range between 1.3145 and 1.3100, including 50% Fibonacci retracement and 21-day SMA respectively, becomes necessary for the pair to register increased volatility.
61.8% Fibonacci retracement at 1.3054 and an upward sloping trend line stretched since early November at 1.3000 now, can question the sellers during the pair’s downside below 1.3100.
Should there be increased selling under 1.3000 mark, December monthly low near 1.2900 will lure the bears.
Alternatively, the monthly high surrounding 1.3285 will be the buyers’ choice if prices manage to cross 1.3145. Further, 23.6% Fibonacci retracement and December month top, near 1.3340 and 1.3515, will be in focus during the pair’s rise after 1.3285.
GBP/USD daily chart

Trend: Sideways
