USD/CAD Price Analysis: 1.3105/10 keeps the upside limited
- USD/CAD stays above 23.6% Fibonacci retracement for over a week.
- 200-bar SMA, monthly top and December 18 low restrict immediate advances.
USD/CAD takes rounds to 1.3050 while heading into the European session on Friday. In doing so, the pair remains above 23.6% Fibonacci retracement of its gradual decline from December 03 to January 01. However, prices fail to overcome an area including 200-bar SMA, monthly high and December 18 bottom.
In addition to the sustained trading above 23.6% Fibonacci retracement, normal conditions of 14-bar RSI also favor the pair’s another confrontation to 1.3105/10 resistance confluence area.
Should the quote manages to rise beyond 1.3110, 61.8% Fibonacci retracement near 1.3180 keeps the buyers caged before pushing them to 1.3280 horizontal area.
Alternatively, the bears will look for entry below 1.3030, comprising 23.6% Fibonacci retracement.
As a result, 1.3000 and the current month low near 1.2940 could gain sellers’ attention.
USD/CAD four-hour chart
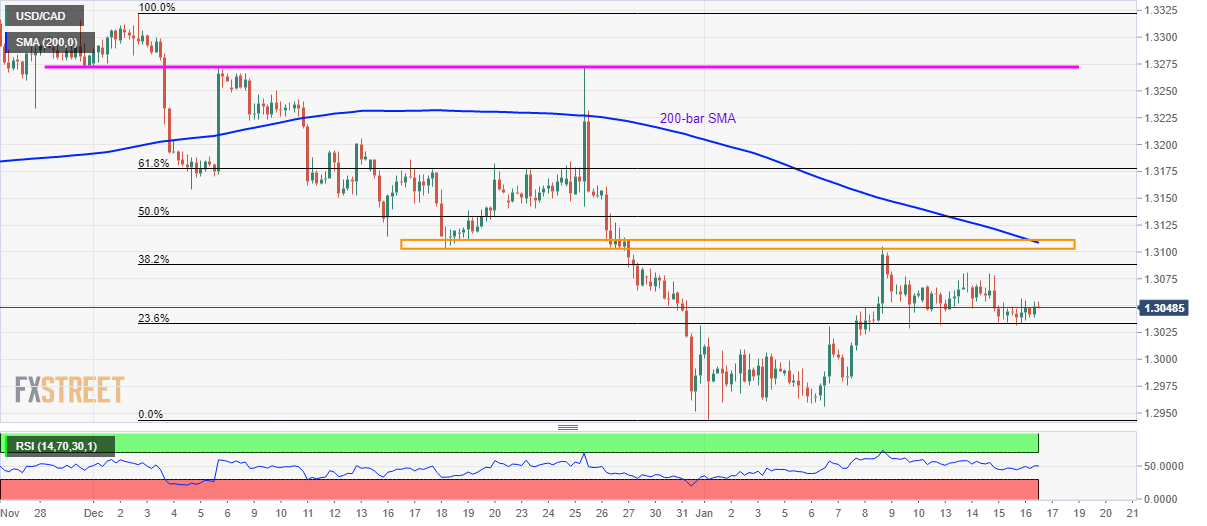
Trend: Sideways