Back
14 Oct 2019
AUD/USD technical analysis: The Aussie recoups parts of daily losses, trading sub-0.6800 handle
The Aussie is starting the week unable to capitalize on last week's gains.
The level to beat for bulls is the 0.6780 resistance.
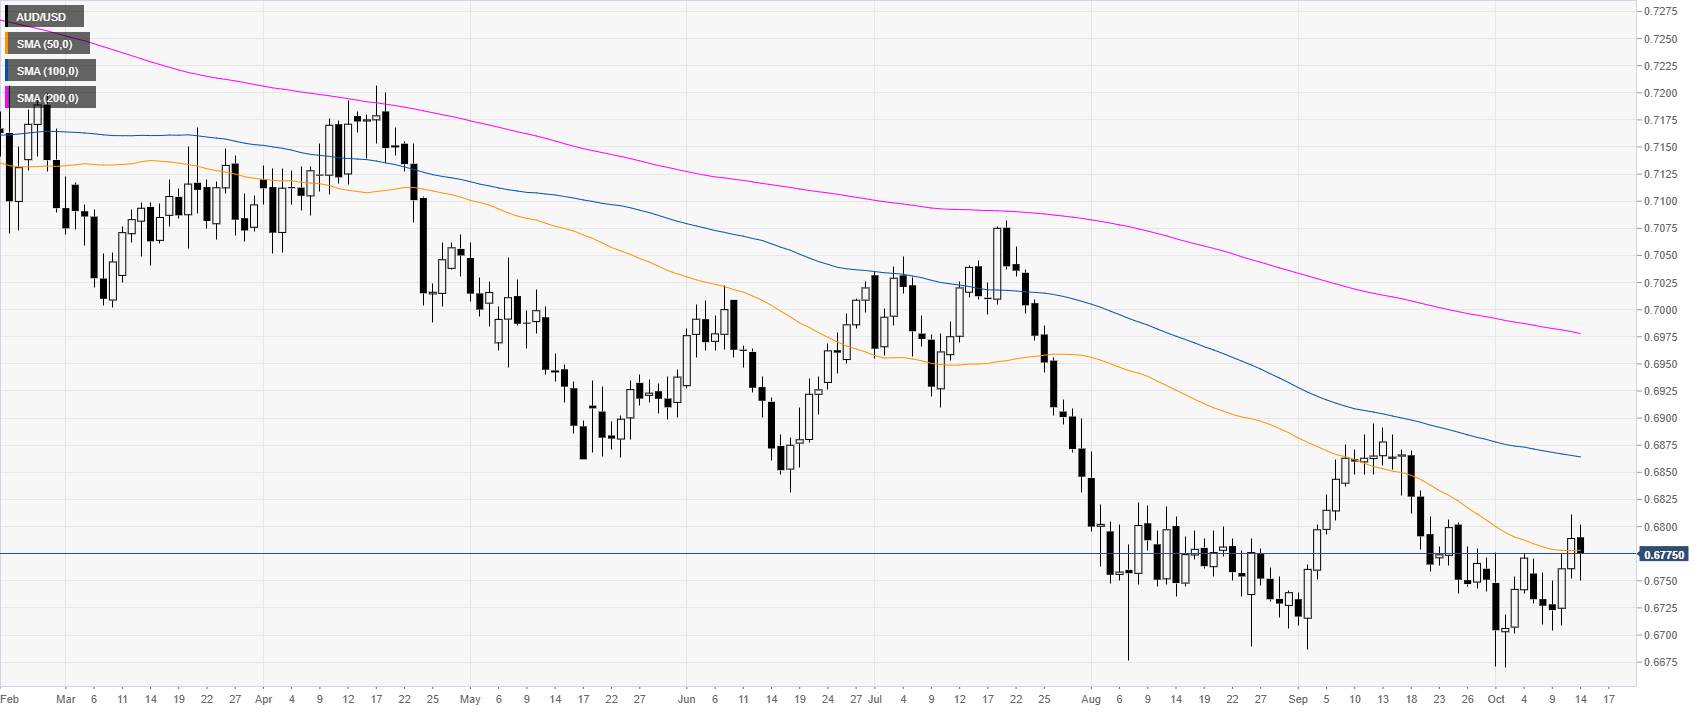
AUD/USD daily chart
The Aussie is trading in a downtrend below its 100 and 200 simple moving averages (SMAs) on the daily chart. Columbus Day in the United States is keeping volatility limited.
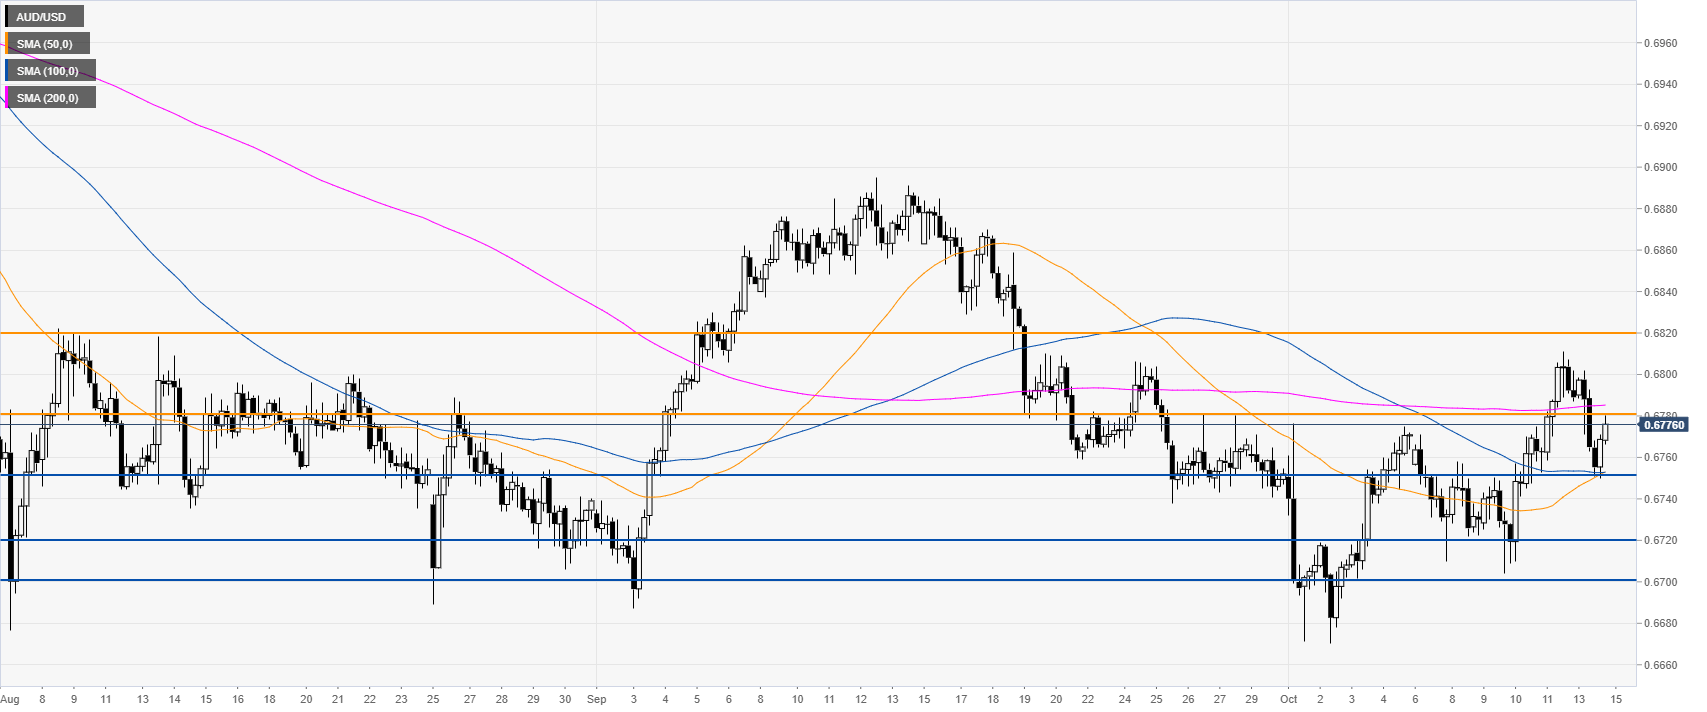
AUD/USD 4-hour chart
The AUD/USD exchange rate is trading between the 100 and 200 SMAs, suggesting a sideways market in the medium term. The spot is challenging the 0.6780 resistance. A break above the level can see the Aussie moving up the 0.6820 level, according to the Technical Confluences Indicator.
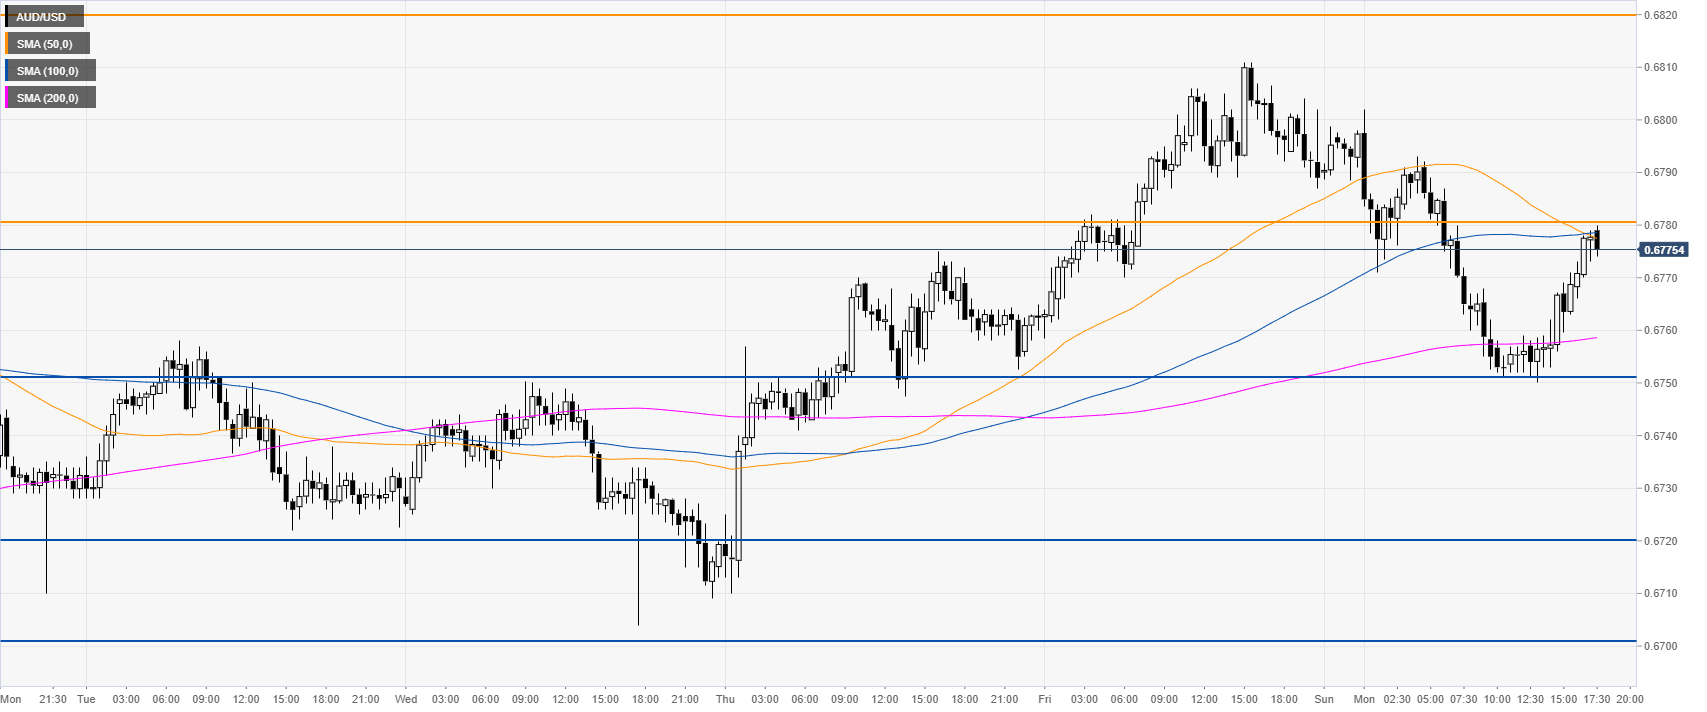
AUD/USD 30-minute chart
AUD/USD is trading below the 50 and 100 SMAs on the 30-minute chart, suggesting a consolidation in the near term. Support is seen at the 0.6750 and 0.6720 price level.
Additional key levels