Back
24 May 2019
US Dollar Index technical analysis: DXY ends the week on its low near 98.60 level
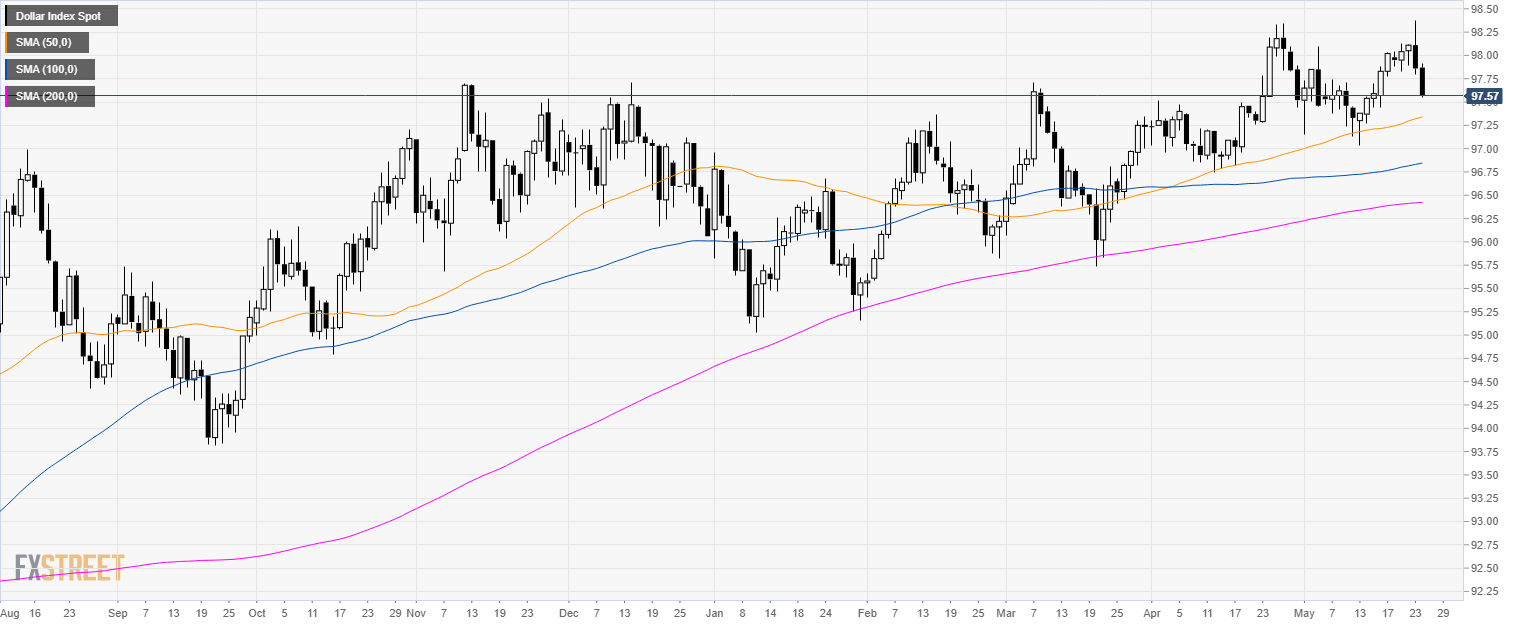
DXY daily chart
The US Dollar Index (DXY) is trading in a bull trend above its main simple moving averages (SMAs).
DXY is trading down for the second consecutive day after establishing a new 2019 high this Thursday.
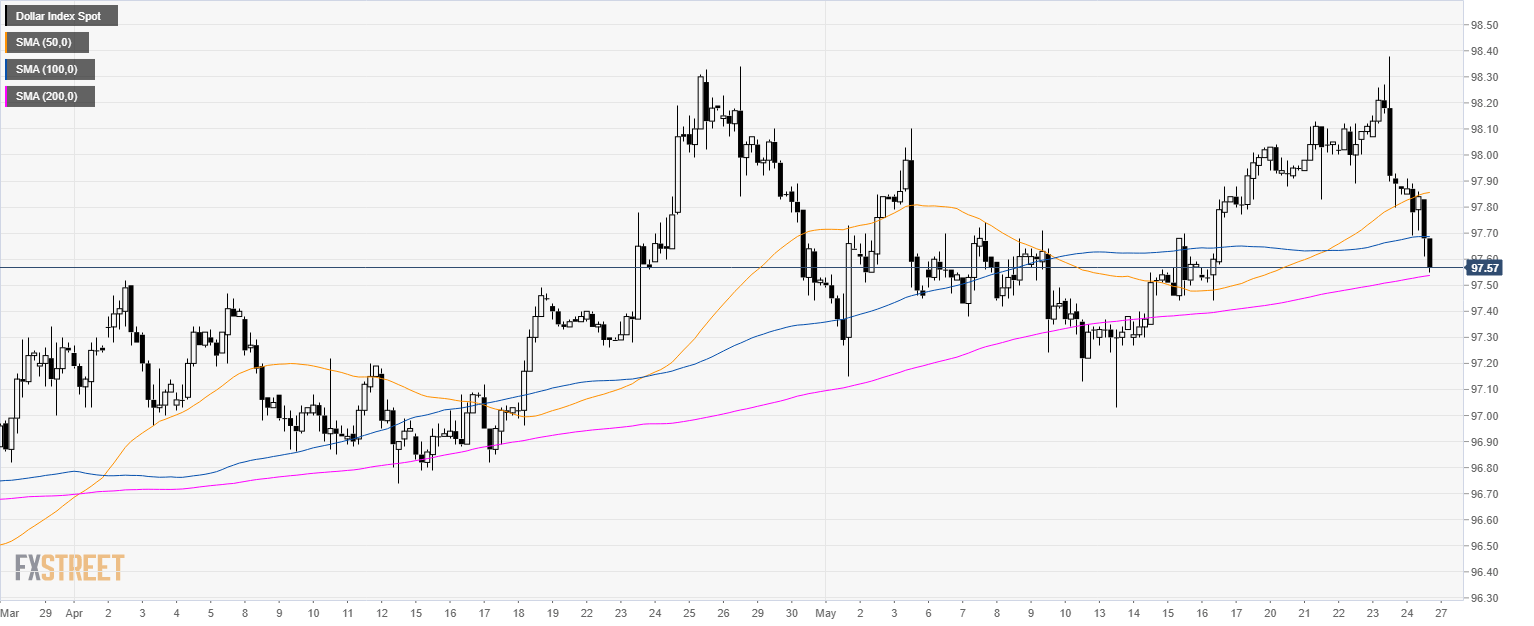
DXY 4-hour chart
The greenback is steeply down just above 97.50 and the 200 SMA.
DXY 30-minute chart
DXY bears took the lead as 97.50, 97.30 and 97.00 become targets to the downside. Resistance is seen at 97.80 and 98.10.
Additional key levels