Back
25 Apr 2019
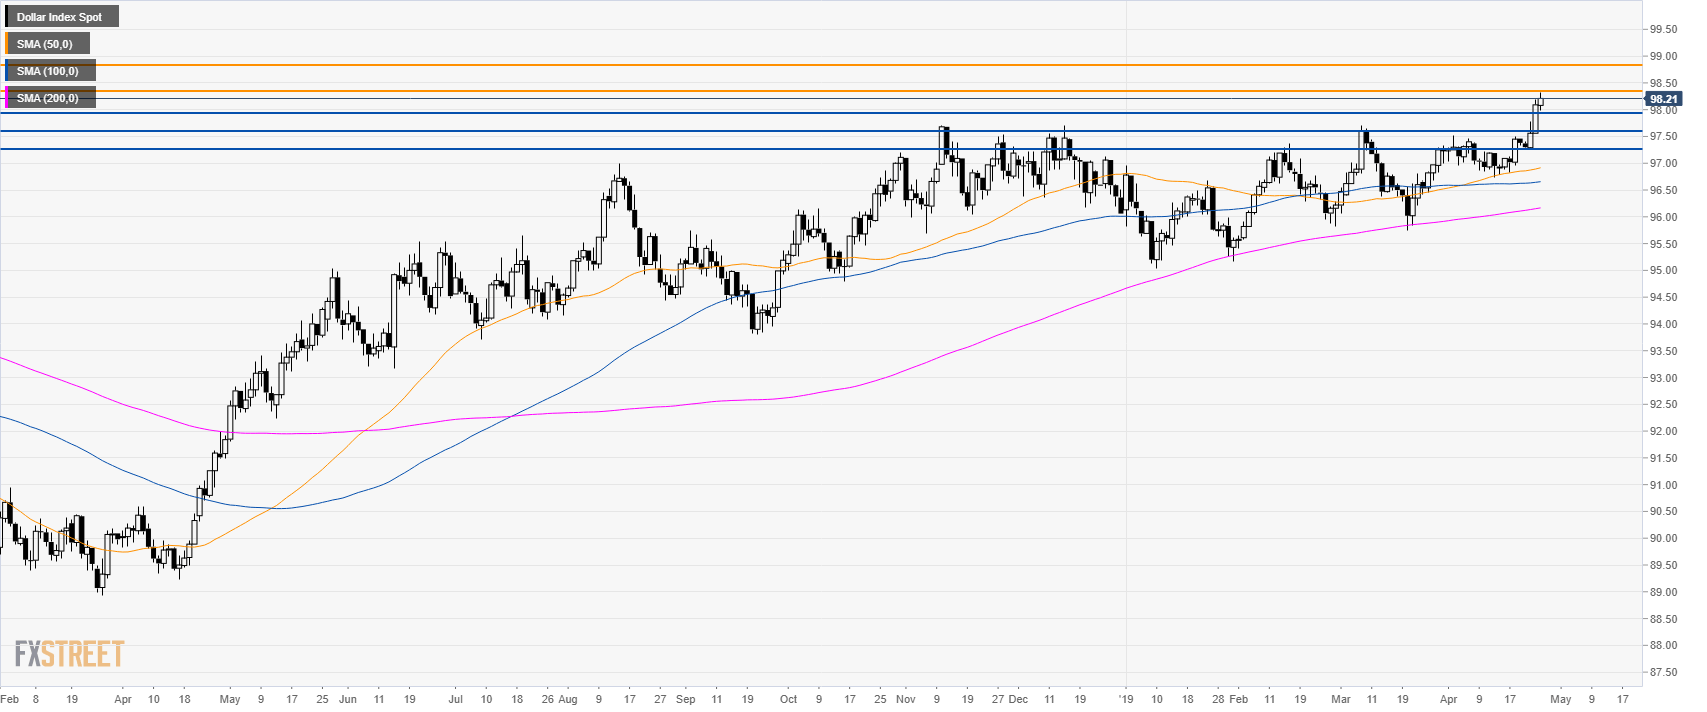
Dollar Index Technical Analysis: DXY looks to extend gains above 98.40 resistance
DXY daily chart
- The US Dollar Index (DXY) is trading in a bull trend above its main simple moving average (SMAs).
- DXY is trading at multi-month highs after breaking key resistance at 97.71 level.
DXY 4-hour chart
- The momentum is bullish as the index trades above its main SMAs.
- The level to beat for bulls is 97.40. A break above the level can lead to 98.80 resistance.
- To the downside, support is at 97.90 and 97.60 price level.

Additional key levels