Confirming you are not from the U.S. or the Philippines

यह बयान देते हुए मैं स्पष्ट रूप से घोषणा और पुष्टि करता/करती हूँ कि:
  • मैं U.S. का/की नागरिक या निवासी नहीं हूँ
  • मैं फिलीपींस का निवासी नहीं हूं
  • मेरे पास सीधे या परोक्ष रूप में U.S. निवासियों के 10% से अधिक शेयर/मतदान अधिकार/हित नहीं हैं और/या मैं अन्य माध्यमों से U.S. नागरिकों या निवासियों को नियंत्रित नहीं करता/करती हूँ
  • मैं 10% से अधिक शेयरों/मतदान अधिकारों/हितों का सीधे या परोक्ष रूप से स्वामित्व नहीं रखता और/या अन्य माध्यमों से U.S. नागरिक या निवासी के नियंत्रण में नहीं हूँ
  • मैं FATCA की धारा 1504(a) के अनुसार U.S. नागरिकों या निवासियों से संबद्ध नहीं हूँ
  • मैं गलत घोषणा करने के अपने उत्तरदायित्व से अवगत हूँ।
इस बयान के प्रयोजनों के लिए, सभी U.S. आश्रित देश और क्षेत्र संयुक्त राज्य अमेरिका के मुख्य क्षेत्र के समान हैं। मैं ऑक्टा मार्केट्स इनकॉर्पोरेटेड, इसके निदेशकों और अधिकारियों को अपने बयान के किसी भी उल्लंघन से उत्पन्न होने वाले या उससे संबंधित किसी भी दावे के खिलाफ बचाव के लिए प्रतिबद्ध हूँ।
हम आपकी गोपनीयता और आपकी व्यक्तिगत जानकारी की सुरक्षा के लिए समर्पित हैं। हम केवल अपने उत्पादों और सेवाओं के बारे में विशेष पेशकश और महत्वपूर्ण जानकारी प्रदान करने के लिए ईमेल एकत्र करते हैं। अपना ईमेल पता सबमिट करके, आप हमसे ऐसे पत्र प्राप्त करने के लिए सहमत होते हैं। अगर आप सदस्यता समाप्त करना चाहते हैं या आपके पास कोई प्रश्न या चिंता है, तो हमारे ग्राहक सेवा केंद्र को लिखें।
Octa trading broker
ट्रेडिंग अकाउंट खोले
Back

Gold Technical Analysis: symmetrical triangular formation on short-term charts

   •  Has been oscillating between two converging trend-lines over the past three-weeks, forming a symmetrical triangle on 4-hourly chart and points to a consolidation phase before the next leg of a directional move.
   •  The commodity's inability to register any meaningful recovery from multi-month lows and acceptance below the very important 200-day SMA qualifies the contracting wedge as a bearish continuation pattern. 
   •  The negative bias would only be confirmed after a decisive break below the pattern support, currently near the $1293 region, albeit a move beyond 200-day SMA would invalidate the bearish outlook. 

Gold 4-hourly chart
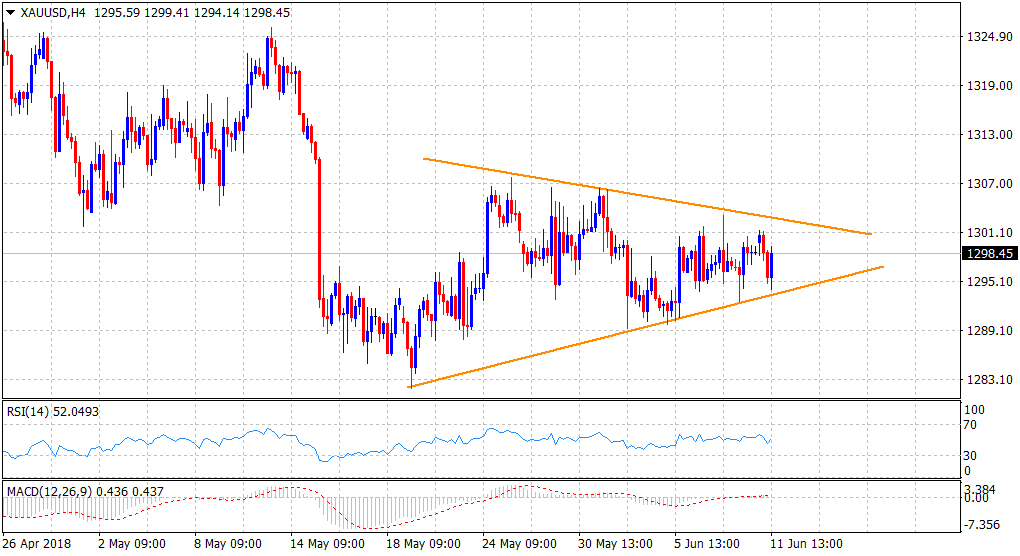
Spot Rate: $1298.45
Daily High: $1301.30
Daily Low: $1294.14
Trend: Range-bound

Resistance
R1: $1303.50 (last Thursday's swing high)
R2: 1306.05 (50-day SMA)
R3: 1313.51 (200-day SMA)

Support
S1: $1294.14 (daily low touched during the European session)
S2: $1289.65 (last Tuesday's swing low)
S3: $1281.70 (multi-month lows set on May 21)
 

ECB: Balancing act - ING

Despite growing uncertainty around the strength of the Eurozone recovery, little underlying inflationary pressure and possible further market turmoil,
अधिक पढ़ें Previous

WTI remains vulnerable, around $65.00

Prices of the West Texas Intermediate are prolonging the weak tone at the beginning of the week, hovering over the $65.00 mark per barrel after bottom
अधिक पढ़ें Next